
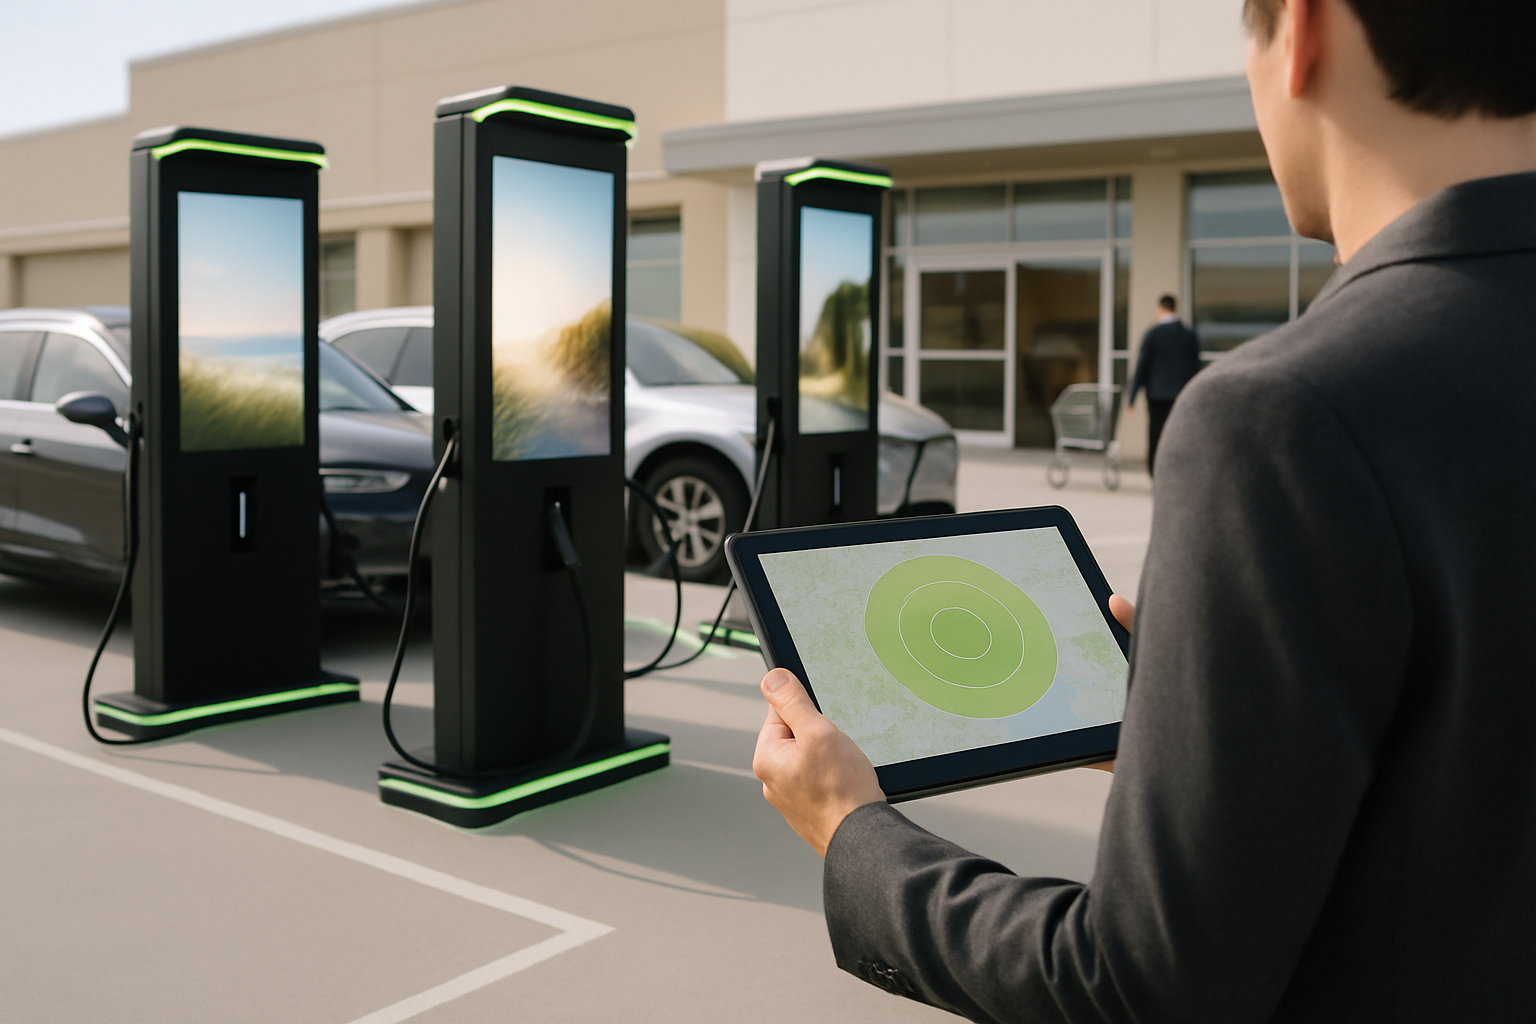
The Saturation Number: What Happens When a Metro Has More Charger Screens Than Plans
Meta description: Screen supply and driver count don’t grow at the same rate in every metro. Here’s the saturation check to run before you add EV charging advertising lots.
As of today, the U.S. Department of Energy’s Alternative Fuels Data Center counts 83,360 public electric vehicle charging station locations and 262,068 public charging ports nationwide — and those figures were refreshed this morning. Advertising screens have gone up alongside them.
Here is the mismatch nobody puts on a rate card. Ports in a metro can grow faster than the number of drivers who live there. When that happens, two lots a mile apart stop behaving like two separate audiences and start competing for the same drivers. That’s saturation. It doesn’t show up in a CPM. It shows up in your frequency, your reach curve, and whether your lot list is still doing the work you paid for.
What saturation actually means for a charger-screen buy
Charger-screen inventory is priced and sold by lot. That’s the right unit for a network, and the wrong unit for a plan if you buy too many lots in one place.
A driver who charges on the same corridor charges at whichever lot is open and convenient. Your first three lots each reach them. Your fourth, fifth, and sixth lots reach them again — and mostly nobody new. Your average frequency climbs, your incremental reach flattens, and your cost per unique driver rises without anyone flagging it.
“Screen count and driver count are two different curves. If you buy the screen curve in a metro where the driver curve is flat, you’re buying repetition and calling it reach.” — Dan Kost, Founder, EV Across America
The fix isn’t to avoid dense metros. It’s to check before you add the sixth lot.
Run the density check before you sign the lot list
Four numbers will tell you most of what you need to know, and you already have access to all of them.
- Ports in the trade area. Count public charging ports inside your geographic buy, not stations. The AFDC state table breaks this out by level: Level 2 and DC fast, separately. A metro with a lot of Level 2 workplace charging has a different screen story than one dense with fast charging at retail.
- Registered EVs in the same trade area. Compare port count against the local EV population. A rising port-to-vehicle ratio means supply is arriving faster than the audience.
- Your overlap. Map the ten-minute drive radius of each lot against the others. Two lots sharing a radius share an audience. Count how many of your lots fall into the same radius before you commit.
- Session count per screen. Ask for the clearing number, not the impression count. Impressions tell you the screen ran. Sessions tell you whether anyone was standing in front of it.
If two lots sit inside the same radius and the network can show you session data, you have a spare lot in the plan. Trim it, or trade it for a lot in an under-served trade area where your incremental reach is still steep.
Where saturation is real, and where it’s a guess
Context matters, state by state. The same national total of 262,068 ports is spread very unevenly. California alone accounts for 20,364 public station locations and 69,552 ports, roughly a quarter of the country’s public ports. New York follows with 20,325 ports, Florida with 15,408, and Texas with 13,098. Wyoming has 357.
Density of screens in a market says nothing about saturation unless you match it to the drivers who charge there. California’s 1,256,646 light-duty electric registrations as of December 31, 2023 — about 35% of the national total, per the same data source — mean the port count is supported by the audience. A small market with a generous charger build-out tells the opposite story.
One caution: public port totals include legacy chargers, and the AFDC’s count does not include residential charging. Since most charging happens at home, port count alone understates total supply. It’s still the best proxy for public standing-dwell inventory, which is what a charger screen sells.
How to rebuild the lot list once you’ve checked
Saturation doesn’t mean the metro is a bad buy. It means the buy is built wrong.
Cover the radius, not the lot. Instead of buying every screen in a dense cluster, buy one screen per drive radius. You keep the coverage and cut the duplicated frequency. The plan ends up smaller and more efficient, not broader.
Weight toward grocery-anchored sites. A charger at a grocery store sits inside a forced in-store trip that already lasts twenty minutes or more. A charger in an office garage sees the same driver on a commuting rhythm, and their adjacent stops are fewer. Where saturation is a risk, retail sites defend their reach.
Add fresh trade areas before you add depth. Saturation is a signal to widen, not deepen. Under-served metros give you steeper reach curves on your first screen. That’s a better use of your next dollar than a fourth screen in a full radius.
Set a frequency ceiling in writing. Decide the maximum number of times the same driver should see your creative on this set of lots, then let the overlap math decide how many lots you carry. If the vendor can’t support session-level frequency, buy fewer lots.
Re-check quarterly. Ports arrive in waves. A metro that looked efficient in Q1 can carry double the screens by Q4. Ask the network for its new location list on a schedule, before the calendar rolls.
Your team can prevent this
Saturation isn’t a station-count problem. It’s a counting problem, and your plan can handle it with four questions on your next request. Ask for ports by level in the trade area. Ask for sessions per screen. Ask for the overlap map. Then buy one screen per radius and put the remaining budget into a trade area where nobody on your list is standing yet.
No more duplicate reach. No more paid frequency you didn’t order. Just a lot list matched to the audience that’s actually there.
Request the current EV Across America location list and session data for your metro. Mail dan@dakdan.com, call 970-436-0580, or visit evacrossamerica.com.
FAQ
Does a dense metro automatically mean wasted ad spend? No. Dense metros usually carry the most drivers. The risk is buying more screens in one drive radius than the audience supports — which inflates frequency without adding reach.
What’s the difference between stations and ports? A station location is a site; a port is a single charging point. Ad screens attach to locations, so ask for both counts. A site with eight ports serves far more sessions than a site with two.
How many charger screens should we carry per metro? Start with one screen per drive radius, then add depth only where session data shows reach still climbing. That’s a data decision, not a market-size decision.
What if the network won’t share session data? Buy smaller and shorter, and ask for a screen health report with each invoice. A network that reports what its screens did is telling you how it treats placements.
Keep the conversation going
Which metro is giving your team trouble on reach? Send the lot list and we’ll run the overlap check with you. Follow EV Across America for more on charger-screen media planning.
EV Across America · dan@dakdan.com · 970-436-0580 · evacrossamerica.com